
New Year Knife-Edge
The markets are completely on a knife-edge as illustrated by many bull-flag patterns that are behaving indecisively and OVIs that are hovering near their neutral lines.
The message is a …

The markets are completely on a knife-edge as illustrated by many bull-flag patterns that are behaving indecisively and OVIs that are hovering near their neutral lines.
The message is a …

They may not be quite ready yet, but there is a growing sense that the markets are coiling on a spring and will be on the move soon … I would say by the end of the year we should have a clear signal…
Hi Everyone Last night’s webinar recording is now available here. In it we did a thorough overview of the OVI-Flag combo strategy, we analyzed a number of stocks including KORS,…

Hi Everyone A huge thank you! Just hours after our webinar we’re #1 on Amazon’s Bestseller list for Stocks. Here’s the screenshot … I’ll send the recording for the webinar late…
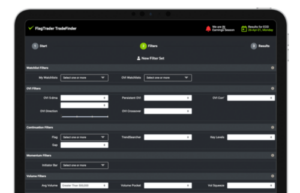
Hi Everyone A quick tip on how to use our filters intelligently in FlagTrader. * Let’s say you start your routine with the OVI Traders Club Express40 stocks. * You see that CVX and SLB bot…
Hi Everyone Your regular routine should only take a few minutes. Once in a while you may want a more thorough look at the market, but essentially it should be as follows: 1. Check the OVI E…
Hi Everyone The main idices are still grinding up on low volume as we draw to the end of earnings season. The S&P has a marginally positive OVI while the Nasdaq’s is neutral. It’s almo…

Hi Everyone The market creeps up but it’s still a bit ugly out there. Both AAPL and GS have broken out as expected but are both now forming Doji bars. The AAPL one is obvious, but…

Hi Everyone As we draw to the close of earnings season, make no mistake, it’s been ugly out there folks! The main indices have been grinding upwards but on low volume and with rough and volati…
Well, sometimes you just have to allow the market to have rest. Right now we’re seeing a lot of churning and many stocks exhibiting neutral or nondescript OVI readings. That’s fine … the…